As any avid follower of genomics or medical genetics knows, genome-wide association studies (GWAS) have been the dominant tool used by complex disease genetics researchers in the last five years. There’s a very active debate in the field about whether GWAS have revolutionized our understanding of disease genetics or whether they were a waste of money for little tangible gain. No matter where you fall in that spectrum, however, you need only to browse the table of contents of any recent issue of Nature Genetics to see how ubiquitous they are. Since GWAS provide so much of the fodder for unzipping your genome, and in order to help you cut through the hype in the mainstream press coverage of GWAS, I’ve put together a quick primer on how to go straight to the original paper and decide for yourself whether it’s a landmark finding or a dud.
The basic GWAS approach is to look at approximately a million positions in the human genome (called ‘SNPs’) where different people carry different versions of the genetic code (so at some particular position I might have an ‘A’ and you might have a ‘C’). I’m going to focus here on the most common GWAS design, called case-control, where the goal is to compare the frequencies of these different versions between a group of healthy individuals (controls) and another group of people with a specific disease (cases). The places where the frequencies between cases and controls are significantly different are therefore associated with risk of developing the disease.
It’s not always that easy, though! Listed below are five issues raised by almost every GWAS and how you can try to zero in on the key details about them in the paper. A few example figures are taken from the WTCCC GWAS, which also serves (in my biased view!) as an excellent example of the right way to carry out one of these studies.
- Sample size. One key thing to look for early in the paper is how many samples the study has managed to collect. GWAS are generally aimed at finding very small effects (increasing your risk by, say, 15%) so they need lots of samples to confirm such small differences with statistical confidence. If a paper has fewer than a thousand cases and controls you should be suspicious. There are some exceptions (like big genetic effects on severe side effects from drugs), but these are rare.
-
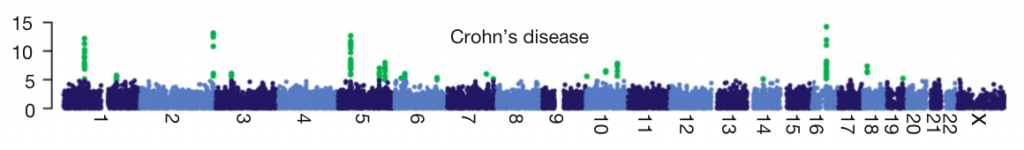
Quality control. The biggest challenge to successfully carrying out a GWAS is getting good, clean genotype data. Pay close attention not only to the standard QC metrics (genotype call rate, Hardy-Weinberg equilibrium, etc) but also to whether extra attention was focused on the genotypes of the most associated SNPs. Most GWAS practitioners go to great lengths to find lab problems that might create false positive associations, but even after years of these best practices being understood, there are sometimes still GWAS published where authors, reviewers and journal have all missed possible genotype QC issues. Good QC should filter out artifacts, and yield a ‘manhattan plot’ like the one below. Each point is a SNP laid out across the human chromosomes from left to right, and the heights correspond to the strength of the association to disease. You’ll see that the strongest associations (highlighted in green) form neat peaks where nearby correlated SNPs all show the same signal. Any manhattan plot with points all over the place should be viewed as highly suspicious (as raised by Daniel in this excellent post).
-
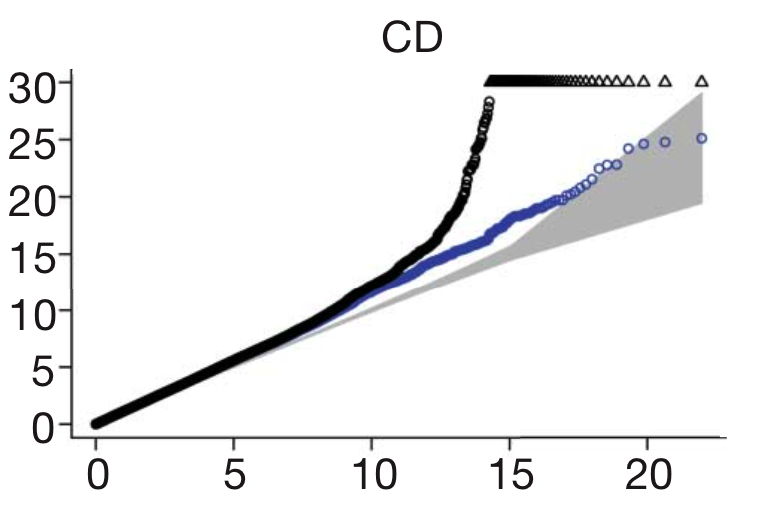
Confounders. Be on the lookout for any variable in the study which could be different between cases and controls other than the disease itself. For instance, if the disease is more common in one part of the world than another, and this effect isn’t accounted for, then the naturally arising genetic differences between those groups of people will look like they’re associated with disease. This ‘population structure’, as it’s called, is the most commonly discussed confounder, but many others exist, such as whether cases and controls were genotyped in the same laboratory, or the DNA was collected by the same method.One statistical tool, called the ‘QQ plot’ is a common way for GWAS to show that confounders aren’t at work. The QQ plot shows the expected distribution of association test statistics (X-axis) across the million SNPs compared to the observed values (Y-axis). Any deviation from the X=Y line implies a consistent difference between cases and controls across the whole genome (suggesting a bias like the ones I’ve mentioned). A clean QQ plot (see below), on the other hand, should show a solid line matching X=Y until it sharply curves at the end (representing the small number of true associations among thousands of unassociated SNPs). The blue points in this figure show what’s left after removing the validated associations, which shows that most of that tail was, in fact, due to true disease variants, but also that more interesting results might still be lurking in the data.
- Replication. The ultimate arbiter of a GWAS result is whether it can be replicated independently. It’s important to remember that this doesn’t just mean independent samples (though that’s crucial) but also using an independent technology. That way, any QC problems or confounders which affected the original study won’t affect the replication.
- Biology. Given that a GWAS has some firm results, there’s almost always some speculative comment about why these regions of the genome are important to this disease. Take this section with a grain of salt, since it’s surprisingly easy to dig up a paper published at some point in history to support almost any functional hypothesis!


 RSS
RSS Twitter
You make some very good points about factors that can take the magic out of a GWAS or lead to fantastic but untrue findings. Sample size is a big one, but its effect can be mitigated by a well defined pedigree structure.
In our experience we have found quality control on the front end (in study design) and on the back end (standard statistical corrections) to be something of an “elephant in the room” for SNP and, particularly, CNV genome-wide studies.
We did a webcast on the subject about a year ago linked below.
http://www.goldenhelix.com/Events/recordings/study-design/index.html
Great post!
Thanks for sharing the information on how to assess the quality of a GWAS study. In epidemiology (genetic or otherwise), this needs to be done on a regular basis. Many of the same factors important for a quality GWAS also hold true for high quality non-genetic epidemiolgoic studies such as: sample size, study design, confounding/bias (uncontrolled structure in population) and phenotype/exposure definition. It is also important to keep in mind study differences when combining results into a meta-analysis.
Keep up the good work!
Great post and great writing. This kind of format–lots of perspective and background, practical advice, examples that are easy to follow–is really helpful in understanding these issues. I encourage you to continue to write at this “level” so that your ideas are accessible to everyone. -W
Nice intro to GWAS. I think a little more elaboration on the population stratification issues, use of PCA to correct for correlated SNPs, time to event analysis, issues of age matching in some instances can be added.
However, the most important lacunae I see is the interpretation of results. A concise summary of OR, HR, GRR and PAF may be useful. Considering the title of the article, I believe that is a required ingredient.
Cheers
JVJ
@JVJ
We have some posts planned discussing genetic epidemiological shizzle in the near future, stay tuned!
For the unitiated, the acronyms JVJ are using refer (I think) to:
Odds Ratio
Hazard Ratio
Genotype Relative Risk
Population Attributable Fraction
I apologize for jumping the gun here.
I realize that a new article on interpretation of results is a better way to approach them in detail.
Thanks Jeff for the wonderful little piece on GWAS. Hope to see many more interesting articles. Thanks Luke
JVJ
Thanks Jeff for the informative article posted, it serves as a good introduction to new entrants into this field. I hope more discussions and elaborations on this subject can come through.
Keep up the good job!
Thank you for talking in terms which a layperson can understand. It really is difficult to get non-technical information about GWA studies which non-scientists can understand, and yet since this field has such a broad impact, I think it is important to have educational materials for everyone who wants to learn.
Extremely nice and helpful intro to GWAS. In assessing confounders using Q-Q plots, what is is the expected distribution of the test statistic (i.e., the x-axis)? Is it X^2, or Normal, or uniform, or Beta? I seem to see all of these.
Thanks for the article.
JEL
Hi,
Its very well written. I am also doing association analysis in plants but I am little confused with my manhattan plot where only sinle SNPs are going on the top and not accompanying any nearby SNPs, is my data are not fruitful? I want to attach here the plot but not attachment option is there.
Thanks,
Vinod Kumar